关于prometheus的基础内容,可以去看https://www.hi-linux.com/posts/25047.html 、https://yunlzheng.gitbook.io/prometheus-book/ 和https://www.ibm.com/developerworks/cn/cloud/library/cl-lo-prometheus-getting-started-and-practice/index.html 。
服务器说明:阿里云centos 7.6(内网IP:172.31.0.85) + docker 19.03.2 + git 1.8 + go 1.13
go的安装方法如下,国内可用:
1
2
3
rpm --import https://mirror.go-repo.io/centos/RPM-GPG-KEY-GO-REPO
curl -s https://mirror.go-repo.io/centos/go-repo.repo | tee /etc/yum.repos.d/go-repo.repo
yum install -y golang
部署Prometheus Server
首先,创建一个普通用户,比如叫lcshop,然后gpasswd -a lcshop docker,把lcshop用户添加到docker组里。
然后在/mnt下创建promethues文件夹和子文件夹server,树形结构如下:
1
2
3
4
5
6
7
8
9
[lcshop@lcshop-Prometheus mnt]$ tree
.
└── prometheus
└── server
├── prometheus.yml
└── rules.yml
2 directories, 2 files
[lcshop@lcshop-Prometheus mnt]$
其中/mnt/promethues/server/prometheus.yml的内容是这样的:
1
2
3
4
5
6
7
8
9
10
11
12
13
14
15global:
scrape_interval: 60s # 默认抓取间隔, 60秒向目标抓取一次数据。
external_labels:
monitor: 'codelab-monitor'
# 这里表示抓取对象的配置
rule_files:
#- 'prometheus.rules'
scrape_configs:
#这个配置是表示在这个配置内的时间序例,每一条都会自动添加上这个{job_name:"prometheus"}的标签
- job_name: 'prometheus'
scrape_interval: 30s #重写了全局抓取间隔时间,由15秒重写成30秒
static_configs:
- targets: ['localhost:9090']
labels:
group: 'prometheus'
至于rules.yml暂时先为空,再把整个/mnt/promethues文件夹及内部所有文件所属组改成lcshop:docker,启动docker进程:
1
docker run --name=prometheus -d -p 9090:9090 -v /mnt/prometheus/server/prometheus.yml:/etc/prometheus/prometheus.yml -v /mnt/prometheus/server/rules.yml:/etc/prometheus/rules.yml -v /etc/localtime:/etc/localtime:ro prom/prometheus:v2.7.2 --config.file=/etc/prometheus/prometheus.yml --web.enable-lifecycle
阿里云安全组放行9090端口,在浏览器使用外网IP:9090就会看到Prometheus的界面: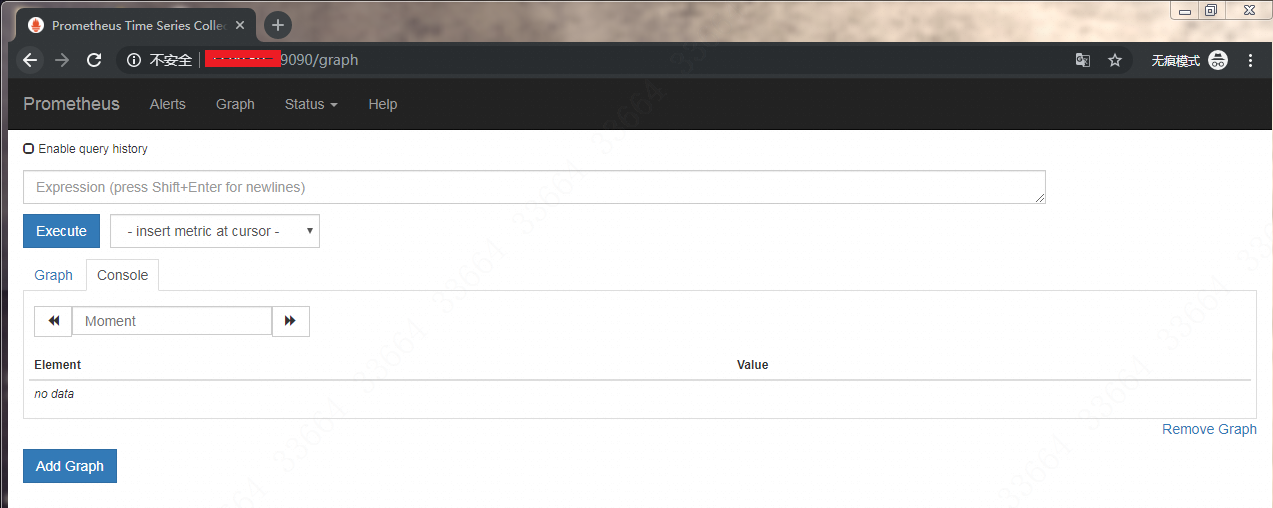
如果输入一些监控值,就会出现对应值的结果: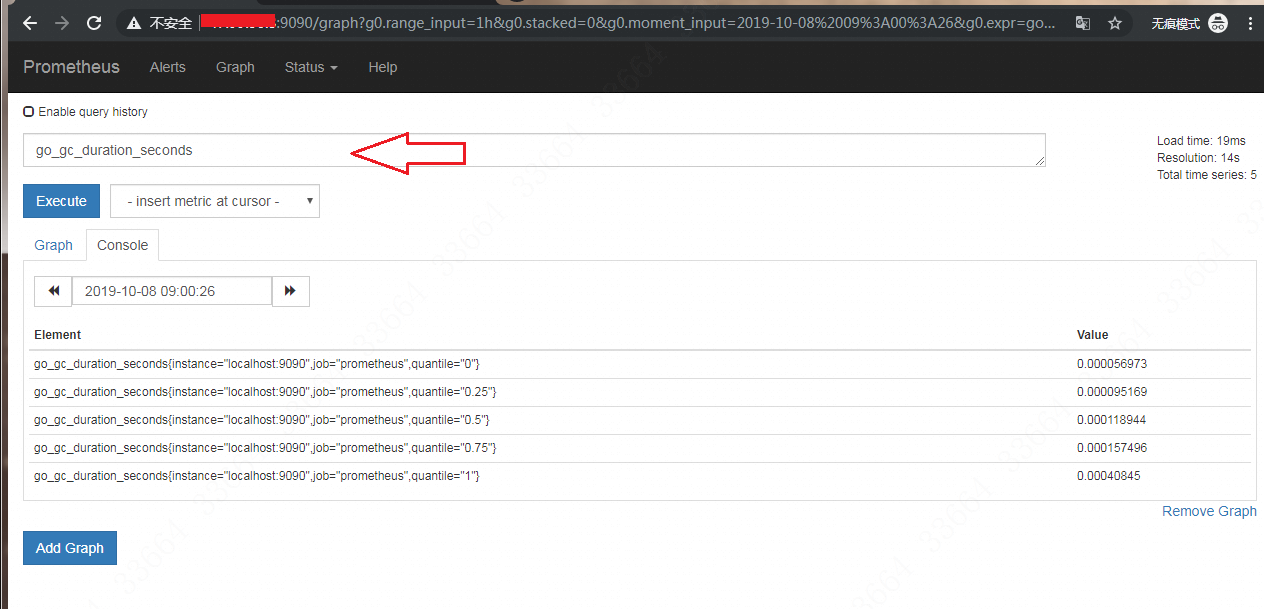
部署Prometheus metrics接口
目前我们的server和grafana已经通了,但是仅仅是有一些无实际作用的指标,我们需要收集服务器的指标,收集指标的东西叫node-exporter。这是一个有点类似于zabbix-agent的东西,会帮你收集系统指标和一些软件运行的指标,把指标暴露出去。Prometheus官方是不推荐用Docker来运行 node_exporter的,因为Docker的文件系统和网络都有自己的namespace,收集的数据并不是宿主机真实的指标。所以我们这里还是用常规的方法,安装方法如下:
1
2
3
4
5
6
cd /usr/local/ && mkdir node_exporter
cd /usr/local/node_exporter
wget https://github.com/prometheus/node_exporter/releases/download/v0.18.1/node_exporter-0.18.1.linux-amd64.tar.gz
tar -zxvf node_exporter-0.18.1.linux-amd64.tar.gz
cd node_exporter-0.18.1.linux-amd64
./node_exporter
这个启动是前台启动,监听9100端口。我们要改一下,改成systemctl启动,这样后台启动更好。创建/usr/lib/systemd/system/node_exporter.service如下:
1
2
3
4
5
6
7
[Unit]
Description=node_exporter
[Service]
Restart=on-failure
ExecStart=/usr/local/node_exporter/node_exporter-0.18.1.linux-amd64/node_exporter #这里填写的node_exporter 文件的全路径,不然无法启动
[Install]
WantedBy=multi-user.target
保存退出,systemctl daemon-reload之后再systemctl start node_exporter.service就启动了,然后可以curl http://localhost:9100/metrics查看一下是否正常获取服务器指标,如图: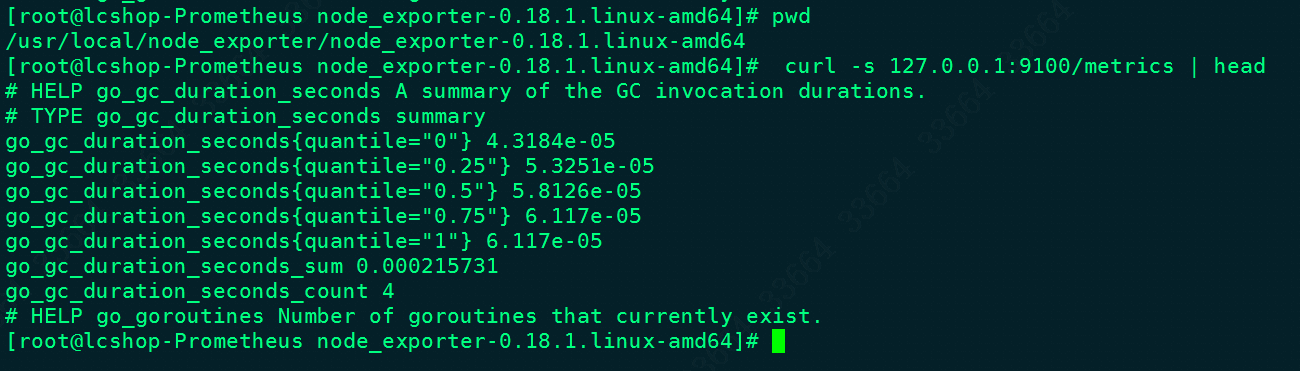
确认可以正常获取到指标之后,就重新编写一下prometheus.yml:
1
2
3
4
5
6
7
8
9
10
11
12
13
14
15
16
17
18
19
20
21
22
global:
scrape_interval: 60s # 默认抓取间隔, 60秒向目标抓取一次数据。
external_labels:
monitor: 'codelab-monitor'
# 这里表示抓取对象的配置
rule_files:
#- 'prometheus.rules'
scrape_configs:
#这个配置是表示在这个配置内的时间序例,每一条都会自动添加上这个{job_name:"prometheus"}的标签
- job_name: 'prometheus'
scrape_interval: 30s #重写了全局抓取间隔时间,由15秒重写成30秒
static_configs:
- targets: ['localhost:9090']
labels:
group: 'prometheus'
- job_name: 'server'
scrape_interval: 30s
static_configs:
- targets: ['172.31.0.85:9100'] #本机IP
labels:
group: 'server'
然后重启prometheus容器,重新载入配置文件。然后在web端的Status -> Targets可以看到添加的node-exporter: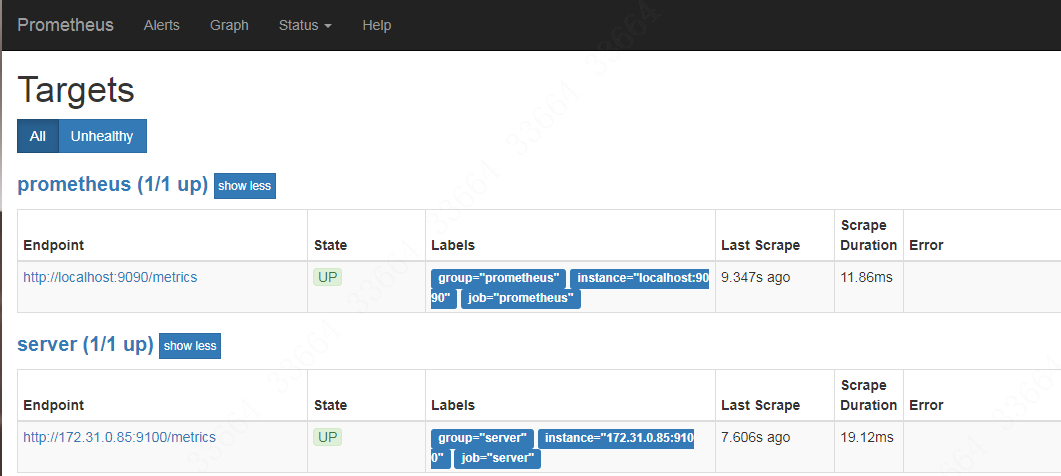
保存之后,就可以在graph页面里查看一些指标。
Prometheus针对mysql、nginx、jmx都有官方的指标收集策略,感兴趣可以去看https://www.aneasystone.com/archives/2018/11/prometheus-in-action.html 。
接入Grafana
Docker部署Grafana的语句可见https://rorschachchan.github.io/2019/08/22/%E6%90%AD%E9%85%8DInfluxDB-CADvisor-Grafana%E7%BB%84%E5%90%88%E7%9B%91%E6%8E%A7Docker/ ,启动之后登录到grafana界面,在Data Source里选择Prometheus,然后就填写对应的url即可: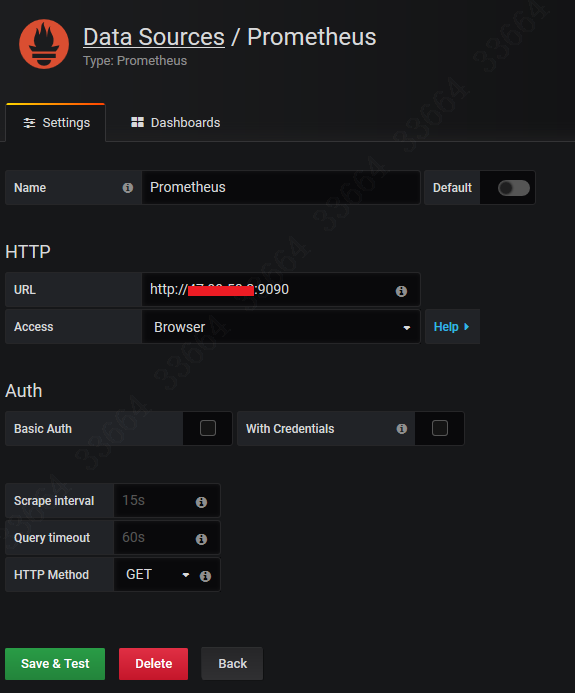
点击旁边的Dashboards,就会有三张模板,根据需要import。如果import了prometheus 2.0 stats,那么生成的格式就是这样的: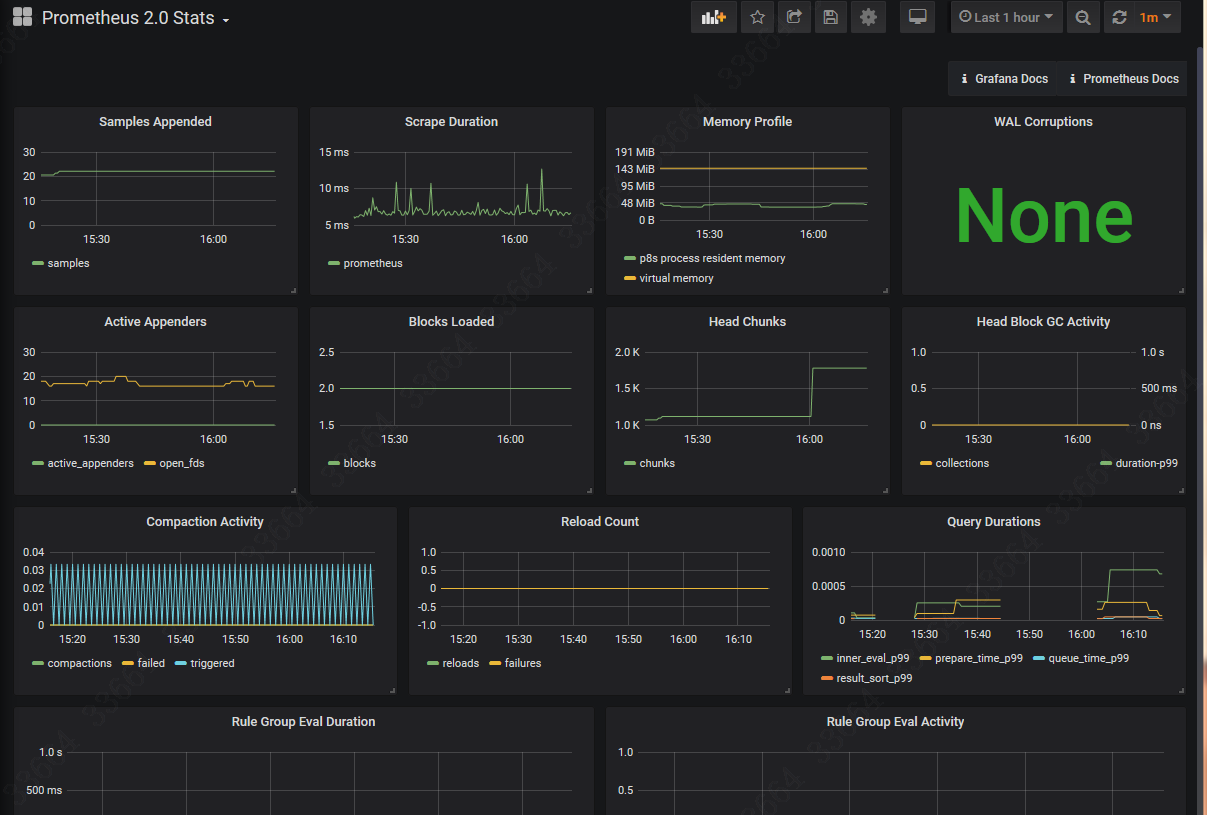
页面看上去还是挺有科技感的,保留这个骨架改一下里面具体的监控项就好了。
Prometheus的监控项跟zabbix的item不一样,它的监控项叫Element,格式是类似这样的:
1
node_load15{group="server",instance="172.31.0.85:9100",job="server"}
这个的意思就是172.31.0.85这个服务器的cpu 15分钟的负载。group、job、instance这些都是这个Element的标签。那么如何找到Element呢?在prometheus的web界面的graph里的console就能看到,如图:
然后在grafana页面在对应的表格里添加该element即可: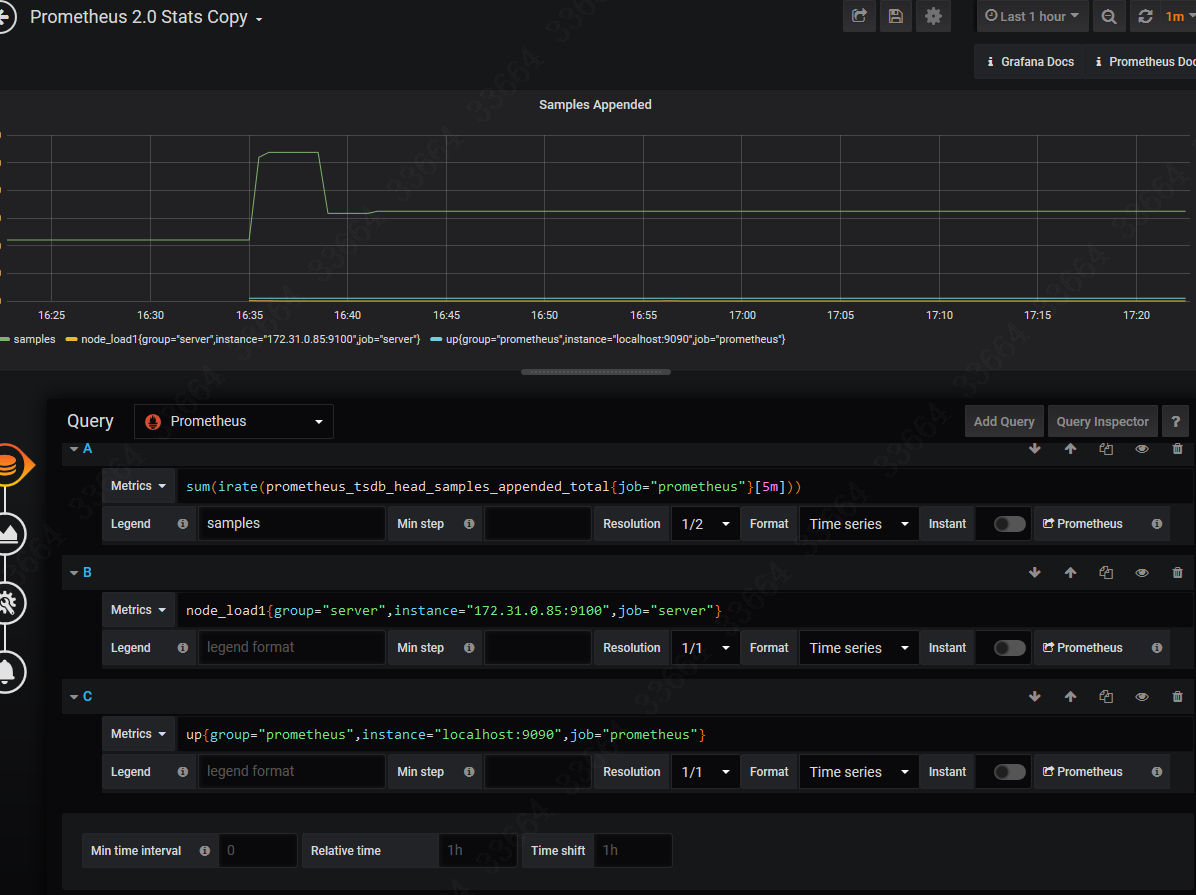
故障排错
在go build的时候,可能会出现大陆特色错误:
1
go: golang.org/x/sys@v0.0.0-20190927073244-c990c680b611: unrecognized import path "golang.org/x/sys" (https fetch: Get https://golang.org/x/sys?go-get=1: dial tcp 216.239.37.1:443: i/o timeout)
此时需要export GOPROXY=https://goproxy.io就OK,如图: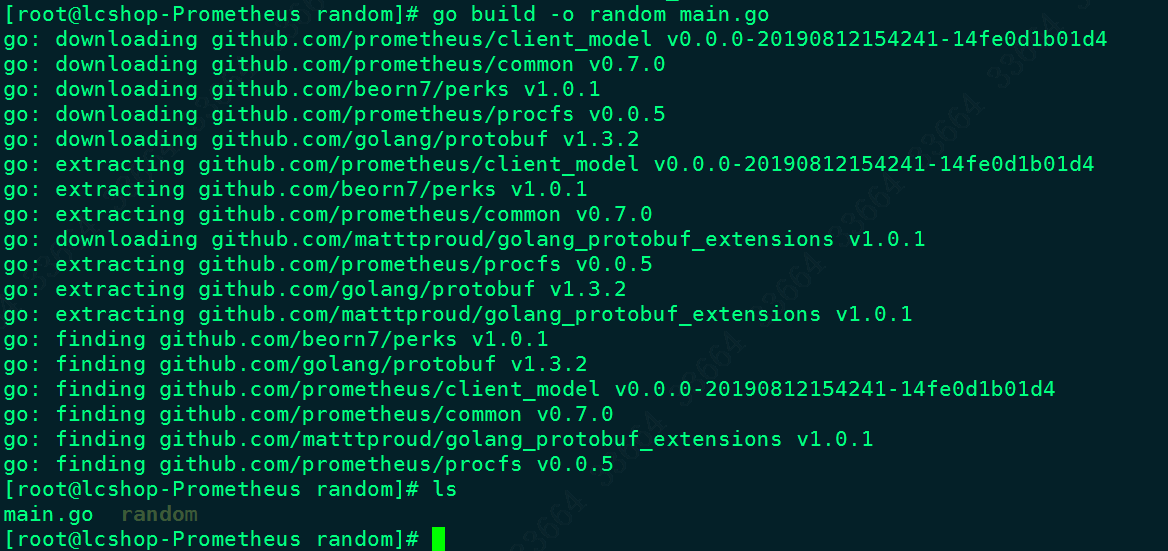
参考资料
https://shockerli.net/post/go-get-golang-org-x-solution/
https://www.aneasystone.com/archives/2018/11/prometheus-in-action.html
https://blog.xizhibei.me/2017/08/06/monitoring-with-prometheus/
https://yunlzheng.gitbook.io/prometheus-book/